
whatoplay’s goal is to make it easier for gamers to discover games to play. We do it by aggregating data from hundreds of online sources (gaming websites, stores, press release websites, social media, etc.).
For the last five years, we have gathered information on the biggest, active gaming platforms (PC, PlayStation 4, Xbox One, Nintendo Switch, Android, iOS, Nintendo 3DS, PS Vita, PlayStation 3, Xbox 360 and Nintendo Wii U). Our database currently has 35,309 released and upcoming games; 126,490 critic reviews; and 920,241,195 gamer ratings.
Scope and Limitations of this Report
The information presented below are based on data gathered by our team, both through manual curation (reading reviews, validating information, updating game details, adding sources, etc.) and automated tools (web scrapers, data cleanup, url status checkers, etc.).
Sources include official stores (Steam, GOG, PlayStation Store, eShop, etc.), press release websites (Gamespress.com, GamePressure, etc.), Wikipedia, gaming websites of different languages and direct submissions. We collect as much data as we can on all gaming platforms except on mobile. Due to the sheer amount of games coupled with our limited resources and lack of access to advanced automation, we had to set a limit for Android and iOS games. For both of these systems, we only add games when they go viral, show up on news, and are reviewed by a critic, submitted by a developer or publisher, or suggested by our community.
Finally, the data, graphs and insights presented in this post are limited to video games. It doesn’t include gamer demographics and sales volume.
2018 Video Game Releases
Let’s start by taking a look at the actual number of releases. As of December 18, 2018, we tracked 10,053 games released on PC, PlayStation 4, Xbox One, Nintendo Switch, Android, iOS, Nintendo 3DS and PlayStation Vita.

We can take a better look at these numbers by comparing them with similar data we have gathered since 2014.

In the last five years, PC has consistently led in number of releases. However, the graph above can be misleading. Note that significant jumps in 2017 and 2018 can be attributed to improvements in the way we collect data. In the last two years, we worked hard in automating parts of our aggregation processes resulting in better coverage of PC games.
Taking a look at current-gen consoles, 2018 marks the first time that Nintendo Switch overtakes the PlayStation 4 and Xbox One in released games. This trend might continue for 2019 as more titles released on the PC, PS4 and XBox One are already ported to the Nintendo Switch.
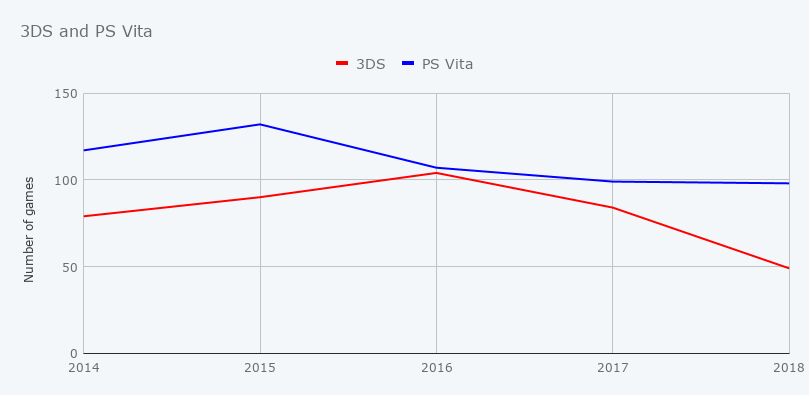
The PS Vita and the Nintendo 3DS are at the end of their lifecycles as both consoles have been in the market for around 8 years now. Sony has announced that they’re not working on a successor to the Vita. Meanwhile, the success of the Switch might be reason enough for Nintendo not to develop a replacement for the 3DS.
2019 isn’t looking good for these two devices either. There are only 40 games coming to the Vita and 20 for the 3DS. For both devices, most of these upcoming games don’t even have a release date yet.

The trend for mobile games, on the other hand, is harder to interpret as our data is incomplete. Our review data shows a preference among online publications for iOS games rather than Android games.
If we dig a little deeper, we can find an interesting trend when it comes to free-to-play mobile games.

The freemium model seems to be working for mobile, for better or worse. When we first saw the trend, the most surprising was the growth of free releases on the iOS. In 2018, 66% of iOS titles that we tracked were free-to-play, a 4% increase from 2017 and a big jump from the 49% of 2014. As for Android, free has always been, at least, 60% of the releases since 2014.
This preference for free games might continue in the next few years as developers try to find the right balance between gameplay and monetization.
- We have always wondered if Sonic 2Sday, a tradition where games are released on Tuesday, is alive and well. It is. 26.2% of games were released on a Tuesday. This is followed closely with Thursday at 23.5%; only 5% are released on weekends.
- The most popular themes of this year are Action, Adventure, Strategy, Simulation, RPG, Puzzle and Platformer. The least popular are Anime, Turn-based RPG, Military, City building and MMORPG.
Critic Reviews
In 2018, we curated 18,524 critic reviews from 91 online publications around the world, in 11 different languages. This is a 6.7% decrease when compared to 19,866 reviews published in 2017.

It’s surprising, given that there were more games released this year than last year. A reasonable explanation would be that this year's releases were just not as attractive to reviewers as last years.

58.63% of these reviews are from English-speaking countries (USA, Canada, UK, etc.). Spanish follows with 12.48%; French is third with 10.88%. Asian and African regions remain under-represented. One of our goals for 2019 is to expand our sources of reviews and cover more languages.

Since 2015, PlayStation 4 has received the most number of critic reviews. Multiplatform games are usually reviewed on the PS4 first.
For example, Red Dead Redemption 2 was released on both the PS4 and Xbox One. The PS4 version received 54 reviews while the XB1 only had 28. Another game, Monster Hunter World was released on the PC, PS4 and Xbox One. The PS4 had 50 reviews, 31 on the PC and 18 on Xbox One.
This might not be as intriguing when you take a look at the total units sold. PS4 has sold more than 80 million units, Xbox One at around 40 million and the Switch, 20 million. From the critics’ perspectives, it pays to review a game on the PS4 first as it’s where most of gamers will play it on.
Matching critic coverage and the number of releases, it would seem that the Nintendo Switch is on its way up. If this trend continues, we can expect Switch to take center stage in 2019.

While the Switch goes up, 3DS and PS Vita are on downward trends. As these handheld consoles drifts closer to their end-of-life in 2019, expect to see further decline in coverage.

The decrease in critics for mobile games is unexpected. We thought since the number of games increased, coverage would follow. This is not the case, however. We can think of possible reasons why this has happened. It could be that the official stores provided all the information needed for mobile gamers to decide which games to play. Or it could also be that there’s just no reward to publishing traditional reviews.
Comparing this data with Google Trends for keywords “ios games” and “android games” shows a sign that this decrease in critic coverage might continue in 2019.

Averaging the number of reviews with the total number of releases and the total number of reviewed games, we can see patterns emerge.
In the case of PC, there’s a big gap. This means that a lot of PC games are left un-tested by critics. Those that do get reviewed, receive more reviews. The gaps aren’t as big as in PC but the same thing can be observed on almost all platforms, except for the Nintendo Switch.
This might be the echo chamber effect in action. When a game gets noticed and a review of it is published, there’s a bigger chance that other publications will review that same game. The opposite could also be true. If a game doesn’t get reviewed, then it’s less likely to ever be reviewed.
Even without referring to this same table, we can conclude the same is true for both Android and iOS.
Critics' Top 10 Most-reviewed Games of 2018

The list above supports the notion that critics do prefer reviewing games on the PS4 more than other systems. Of the games listed, 6 are multi-platform. The rest are three PS4 and one Switch exclusives.
Top 10 Gaming Websites by Number of Reviews Published

The whole of IGN (English, Spanish, Dutch, etc.) has the most number of reviews published. This is followed by the French gaming website Jeuxvideo.com, with the Spanish site Vandal.com on third.
- When do games usually get reviewed by critics? Is it before or after release? Does this timeframe affect the score?
- Do critics update their ratings after the review’s publication?
- Is there a measurable bias on ratings relative to region, release date, publisher, and theme?
- What’s the distribution of critic reviews between platforms?
Gamer Reviews
This year, we aggregated 45,369,030 gamer ratings from 26 active online gaming communities including Steam, GOG and Google Play Store. This may seem like a big number but it pales in comparison to previous years. 2018’s number is a decrease of 47.5% from last year’s and a whopping 70% decrease when compared to 2016.

Overall, there seems to be a reduction in the number of gamers reviewing games. This is still inconclusive. It’s possible that games get reviewed years after they’re launched. This is one aspect that our data can’t track, for now, but it will be covered in our next report.

Looking at the specifics, PC leads in the number of user-generated ratings. PC gamers may just be more inclined to leave a rating. The amount for PS4 are in decline; the same goes for the Xbox One although the drop is not as big. As for the Switch, it’s harder because Nintendo doesn’t allow gamers to leave a rating on the eShop so we had to source our data from other communities that aren’t as active.

Unsurprisingly, the same downtrend is observed for gamer reviews in 3DS and PS Vita. This coincides with the decrease in the number releases.

In mobile, there’s a decrease in Android but not in iOS. It could be that games released this year on the Play Store don’t draw as many users as those from previous years. The idea of games receiving reviews years after initial release might also apply here.

Comparing the average number of ratings per platform with the average of only those that received reviews, gaps show up in some platforms. In PC, Switch, 3DS and PS Vita, this gap is quite significant. It could be the same echo chamber effect pointed out earlier.
The difference is not as prominent for the PS4 and Xbox One. It might be because of better discovery systems within these consoles, with gamers more likely review games that they’ve played. However, it is still uncertain if this same effect is present in Android and iOS as data is lacking.
Gamers' Top 10 Most-reviewed Games of 2017

This can, indirectly, be used as a gauge of relative number of players. If we do think that way, then mobile gaming really is big as both Android and iOS dominate the list above.
- How much does tribalism in gamers affect the score? Are there ways to accurately measure it?
- How often do user-generated reviews get updated? And do these updates affect the playscore?
- When do gamers stop reviewing games?
- Do discounts and sale, like Steam Sale, increase the number of reviews? Do these events bring in more positive or negative reviews?
Playscore
The playscore is our own unique rating system derived by averaging aggregated critic and gamer reviews. We use it to measure the overall reception of a game.
- It’s platform-specific. A multi-platform game will receive different playscores on the system it’s released on.
- It’s dynamic. Due to the fact that it’s based on both critic and gamer reviews, changes in the rating from either sources are reflected within a couple of hours. So if a game pushes an update that fixes a lot of bugs and if it’s followed by a shift towards more positive reviews from gamers, that game’s playscore increases.
- Not all games will receive a playscore. There is a minimum requirement of critic and gamer reviews that is specific to a platform. A game that only reaches one of the requirements, receives a provisional playscore. Those that do not meet the minimum requirements, will get NA or not reviewed.
For more information, visit our playscore FAQ page.
With these in mind, let’s take a look at the playscored games of 2018.

Among major platforms, PS4 has the most games with playscore. This doesn’t come as a surprise. As mentioned earlier, critics seem to prefer testing video games on the Sony console; and with a community that actively rates and reviews games, the PlayStation 4 is bound to have more titles rated.
The Switch and PC are both lagging behind. Again, this can easily be explained based on the critic and gamer data discussed above. Nintendo Switch games get reviewed, a lot, by critics but not much by gamers. This is the reason why it has a lot of titles with provisional playscores.
Meanwhile, the PC releases are lacking in both gamer and critic reviews. It’s just that there are a lot of games launched on the PC.

There’s not much to say when it comes to the 3DS and the PS Vita. It’s clear that interest from both the developers and the public have waned. Maybe the shift towards the Switch or other handheld systems is already happening.

Mobile is far more intriguing. Do keep in mind the limitation of the data presented. iOS leads by a wide margin in the percentage of games with playscore. Android catches up with bigger percentage of games with provisional scores. This leads to more iOS games with no playscore, at all, when compared to Android.
- What is the normal distribution of playscores among all platforms? Can it be used to predict the playscore of a game?
- How long does it take before a game receives moves from provisional to playscore?
- Are there measurable relationships between the playscore and a game’s release date, themes, developer, price and popularity?
Conclusion
The decrease in reviews from both critics and gamers seems to be a general trend and there’s a good chance that this will continue in 2019. What’s astonishing is that this is happening while there’s an increase in the number of games being released.
A plausible theory is that there’s a declining interest in traditional form of game reviews. Most gamers might be looking at other sources for recommendations like Twitch streamers, YouTubers and Steam curators.
It’s also possible that article-type reviews might not be as popular as before. Maybe, a move towards video reviews will do the trick. We’re already seeing this transition in bigger websites like GameSpot and IGN. With gamer reviews, maybe gamers just don’t rate as they used to. Or the lack of a healthy, vibrant platform to leave reviews, as is the case for the Nintendo Switch, is part of the cause.
- We plan to increase our sources of both critic and gamer reviews.
- Sometime in 2019, whatoplay.com will allow visitors to create an account which can be used to rate and review games, with as little censorship as possible. It can also be used to follow publications, developers and critics so they get notified when a new review is published, a game is announced, among other things.
- We’ll also work on building a stronger database, coupled with a time series aggregation. This will increase the accuracy of our next reports.
For questions and inquiries regarding this report and/or whatoplay.com, please don’t hesitate to contact us.